BSA has moved to Balloon Live. Please access the latest version here. This site is not maintained anymore.
![]() The BSA allows to analyze all tracks of a flight and
The BSA allows to analyze all tracks of a flight and
– Search for near-misses
– Search for high ascend and descend rates in proximity of goals (waypoints)
– Find other balloons in proximity of one balloon within a specified time frame
You may freely download and use it. It will require you to update it within some timeframe (usually 1 year) to ensure, that you don’t use any buggy versions.
Use instructions
The software has 4 modes of operation. In all cases the UTC offset and QNH must be given for processing.
Track files must be from balloon competition logger (version 1.3.x or higher) and they must be at 1 second interval. The software uses the barometric variometer of the logger to detect the ascend/descend rate. This is much more accurate than a differentiation based on barometric or GPS altitudes.
- Nearmiss
This mode allows to search for near-misses. Press run and select all track files from the pilots in a flight. The limits are specified in a config file, see below. It will return a list of incidents and allow to print reports. - Vertical
This mode checks for absolute vertical speeds. The limits are specified in the config file. Separate climb and descend limits can be set. - Waypoint
This mode allows to search for ascend and descend limit violations within a proximity of a goal. The goals can be loaded from a Ozi waypoint file. The file may contain multiple waypoints. Then press run and select all tracks during that flight. The limits are specified in a config file, see below.It will return a list of cases with above the limit ascend or descend within the proximity of the waypoints. - Proximity
This mode allows to search for other balloons in proximity of one balloon within a specified time frame. Select one track file of the first balloon and specify the begin time for the time frame to look for the proximity. Specify the duration of the proximity search and the maximum distance between the balloons. Then press run and select all track files from all other balloons. It will return a list of cases of other balloons that were within the specified proximity.
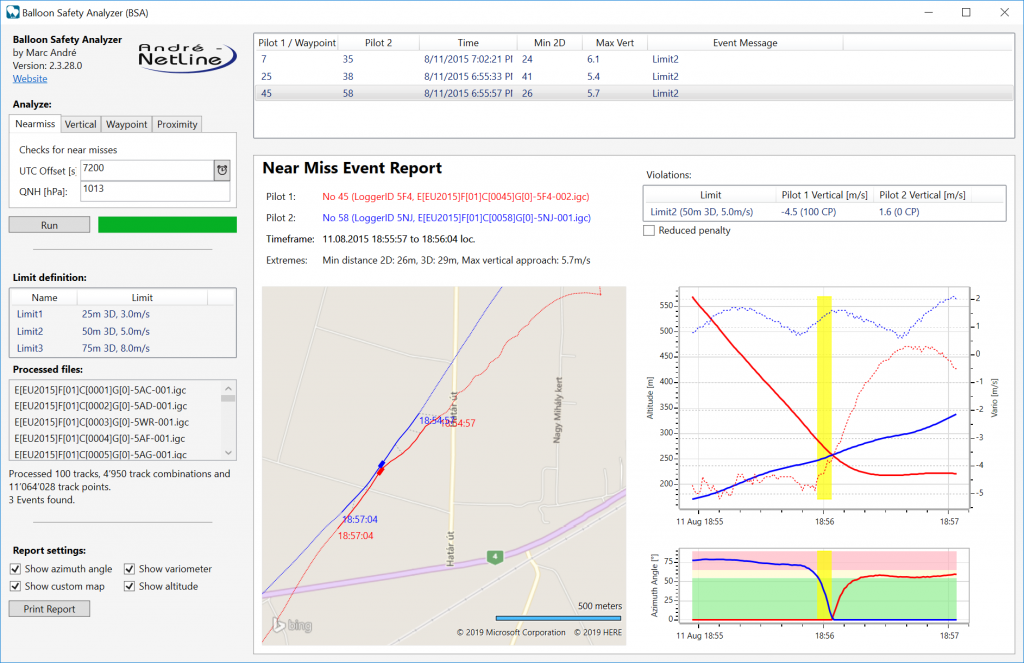
When you click a result it will show the map with the track and a vertical altitude and speed graph. The result can be printed.
Interpretation
Each nearmiss event is visualized with detailed information about the event.
The two involved balloons are colored in red and blue. The Pilot number can be extracted from the file name.
The extreme values are useful to see how close the balloon came to each other.
The violation list shows which limits are violated including the vertical speed for each balloon. The list also shows the recommended penalty as per the COH. In case the operator sees reason to reduce the penalty (also see COH), the reduced penalty checkbox can be activated and the lower penalty values are shown.
The map window shows the tracks of both balloons. The event time is shown using a bold line.
The altitude/vario meter graph shows the altitudes vs. time for both balloons. The alitude is shown using a solid line and the vertical speed using a dotted line. The corresponding scales are shown left and right of the graph. The event time is shown in yellow (note that this section might become so thin that it is not visible).
The azimuth angle graph shows for each balloon under which angle the other balloon was visible. The red and yellow sections show assumed visibilty for razer and normal balloons. Thus in the example above, before the vertical passing, the blue balloon had probably no visibity of the red balloon (large azimut angle, the red balloon was at 75°). This is because the blue ballon was just below the red ballon. After the passing and because of some displacement, the red ballon could maybe see the blue ballon (depending on the balloon shape).
Configuration
The default configuration is created once you’ve run the software for the first time. It contains limits as used during the Europeans 2015.
In order to change any settings, especially the check limits, you need to modify the configuration file after you’ve run (and closed) the software for the first time. The configuration files can be found in your application data folder (usually in c:\users\[username]\AppData\Roaming\Andre-Netline\BSA.xml)
The software knows three limits: NearmissLimits, AbsVerticalLimits and PointLimits. The first is for the near-miss search, the second for waypoint search. The parameters are quite self-explanatory, just have a look at the default config file.
If you want to revert to the default config, just delete the file and start BSA. It will write the file again with default configuration settings.
Installation
Download the installer and run it.
The software requires the same pre-requirements as BLM.
BSA
 setup_bsa.exe
» 2.2 MiB - 1,212 hits - March 2, 2019
Balloon Safety Analyzer BSA latest installation file (2.2.28)